

The Inventory report (Reports › Inventory) tells you what you are holding: how much stock, what it is worth, what it cost, and how it is aging. Where the Sales report looks at what left the shelves, this one looks at the shelves.
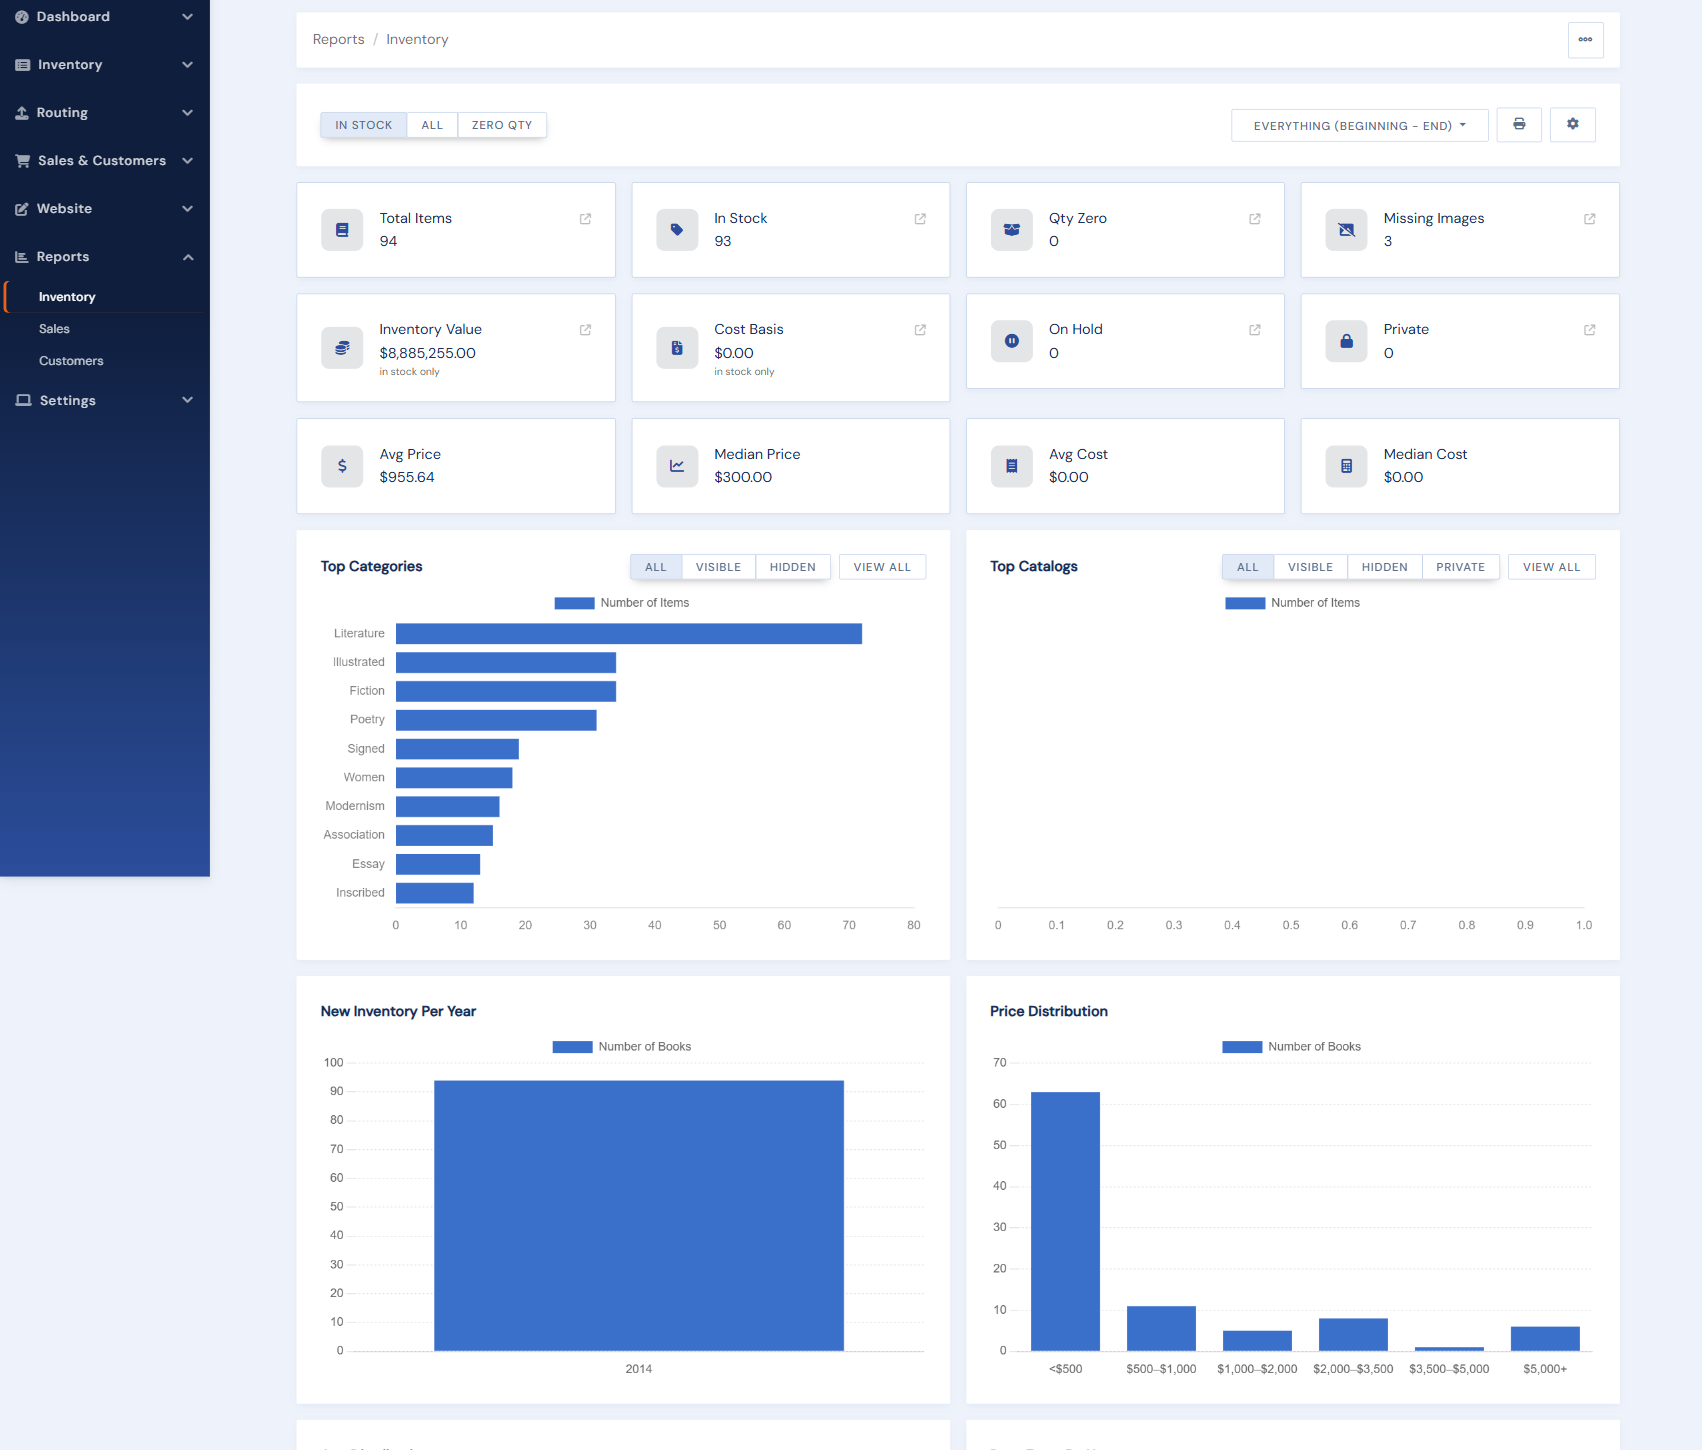
The dashboard
Headline numbers (item count, retail value, cost basis, potential margin) with breakdowns by status, category, and catalog, and charts of how inventory has been added over time. Filters let you scope to in-stock items only, particular categories, or a date-added range.
Inventory value and year-end
The Inventory Value view charts value and cost by year, and the Year-End view produces the numbers your accountant asks for every January: item count, total value, and total cost as of a year's close. Past years can be snapshotted and locked so the figures your taxes were filed on never drift; the current year always calculates live.
Printing and exporting
Every view has a Print button producing a clean report with your shop name and the filter context in the header, and exports for the detail data.
Margin numbers need cost data. If you have not been recording cost, the report still works; the margin figures just stay blank. Recording cost going forward (and backfilling it where you can) makes this report far more useful. See Editing item fields.