

The Sales report (Reports › Sales) is built on your unified sales history, so it shows every channel together: website, in-store and POS, invoices, and (when enabled) your marketplace sales. It is the place to answer "how is the business actually doing?"
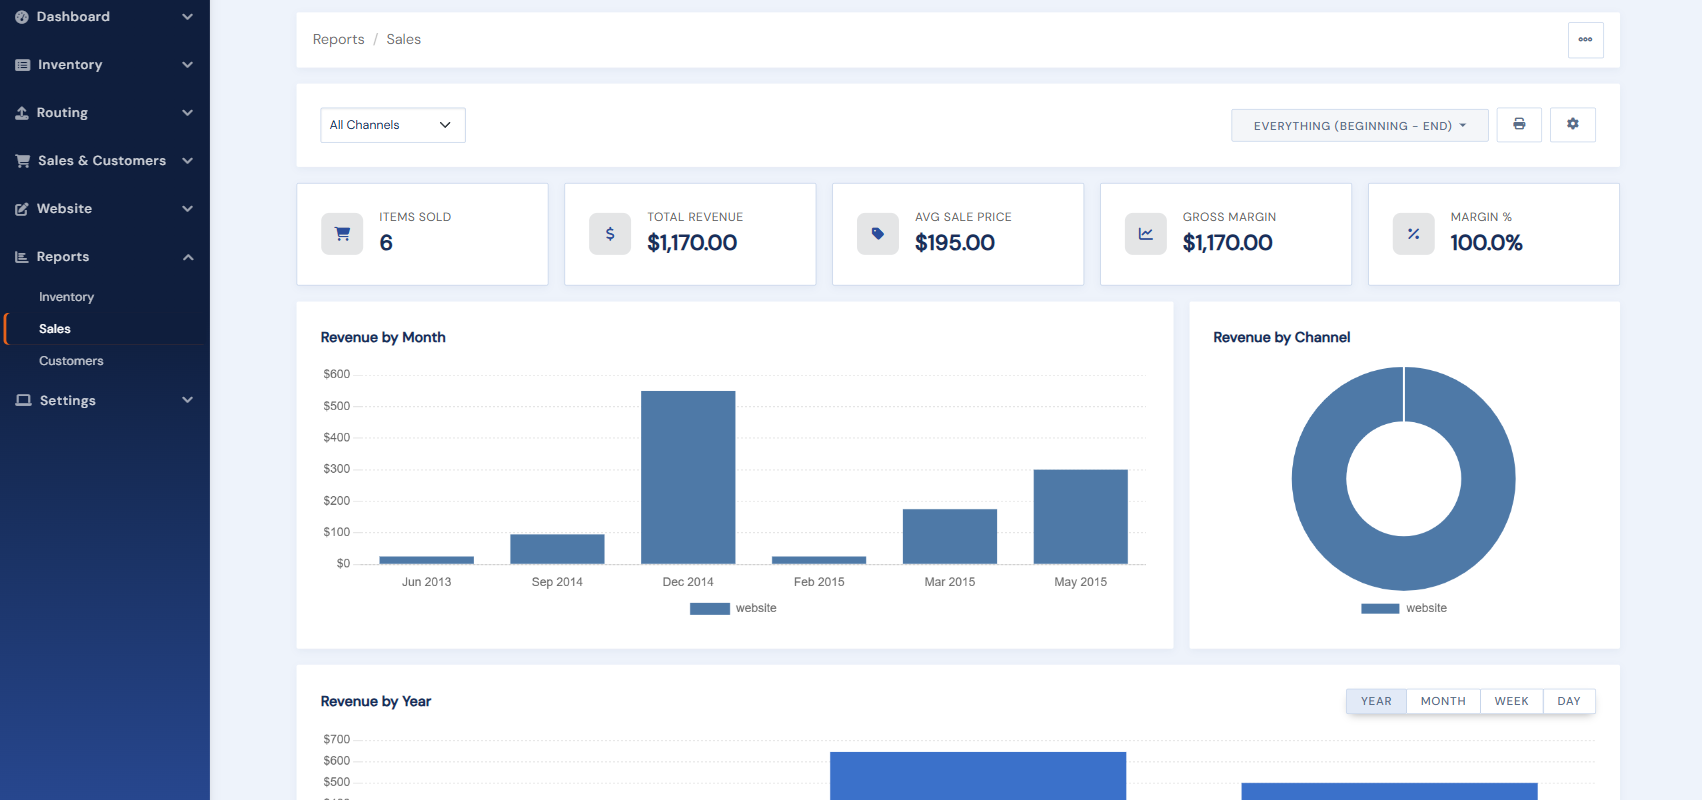
The dashboard
Pick a date range and the dashboard shows revenue, items sold, and margin (where cost data exists), a sales-over-time chart, a channel breakdown donut, year-over-year comparisons, and rankings of top items, categories, and customers. Nearly everything is clickable: a chart segment, a donut slice, or a ranking row drills into the matching detail view with the filters applied.
The detail view
The Sales detail page lists individual sale lines with filters for date range, channel, SKU, category, and customer, shown as removable chips. Use Download to export the full filtered set as CSV or Excel, and the Print button for a clean printed copy; both respect your filters.
Marketplace channels
Marketplace sales flow into your sales history automatically, but they only display in reports once multi-channel sales is enabled for your account (a one-click enable, offered right on the dashboard when marketplace data exists). Until then the report shows your direct channels only.
Settings and preferences
The gear menu on the report links your per-user Report Preferences (default date range, channel, and granularity) and the Sales Data & Import page, which backfills historical sales into the unified history. The site-wide multi-channel toggle lives under Settings › Selling Options › Sales Channels.