

Don't see BookRouter™ when you log in? See How to Access BookRouter™
The Dashboard is the first page you see after logging in. It is designed to answer three questions at a glance: how are sales going, is anything waiting on me, and are my marketplace connections healthy?
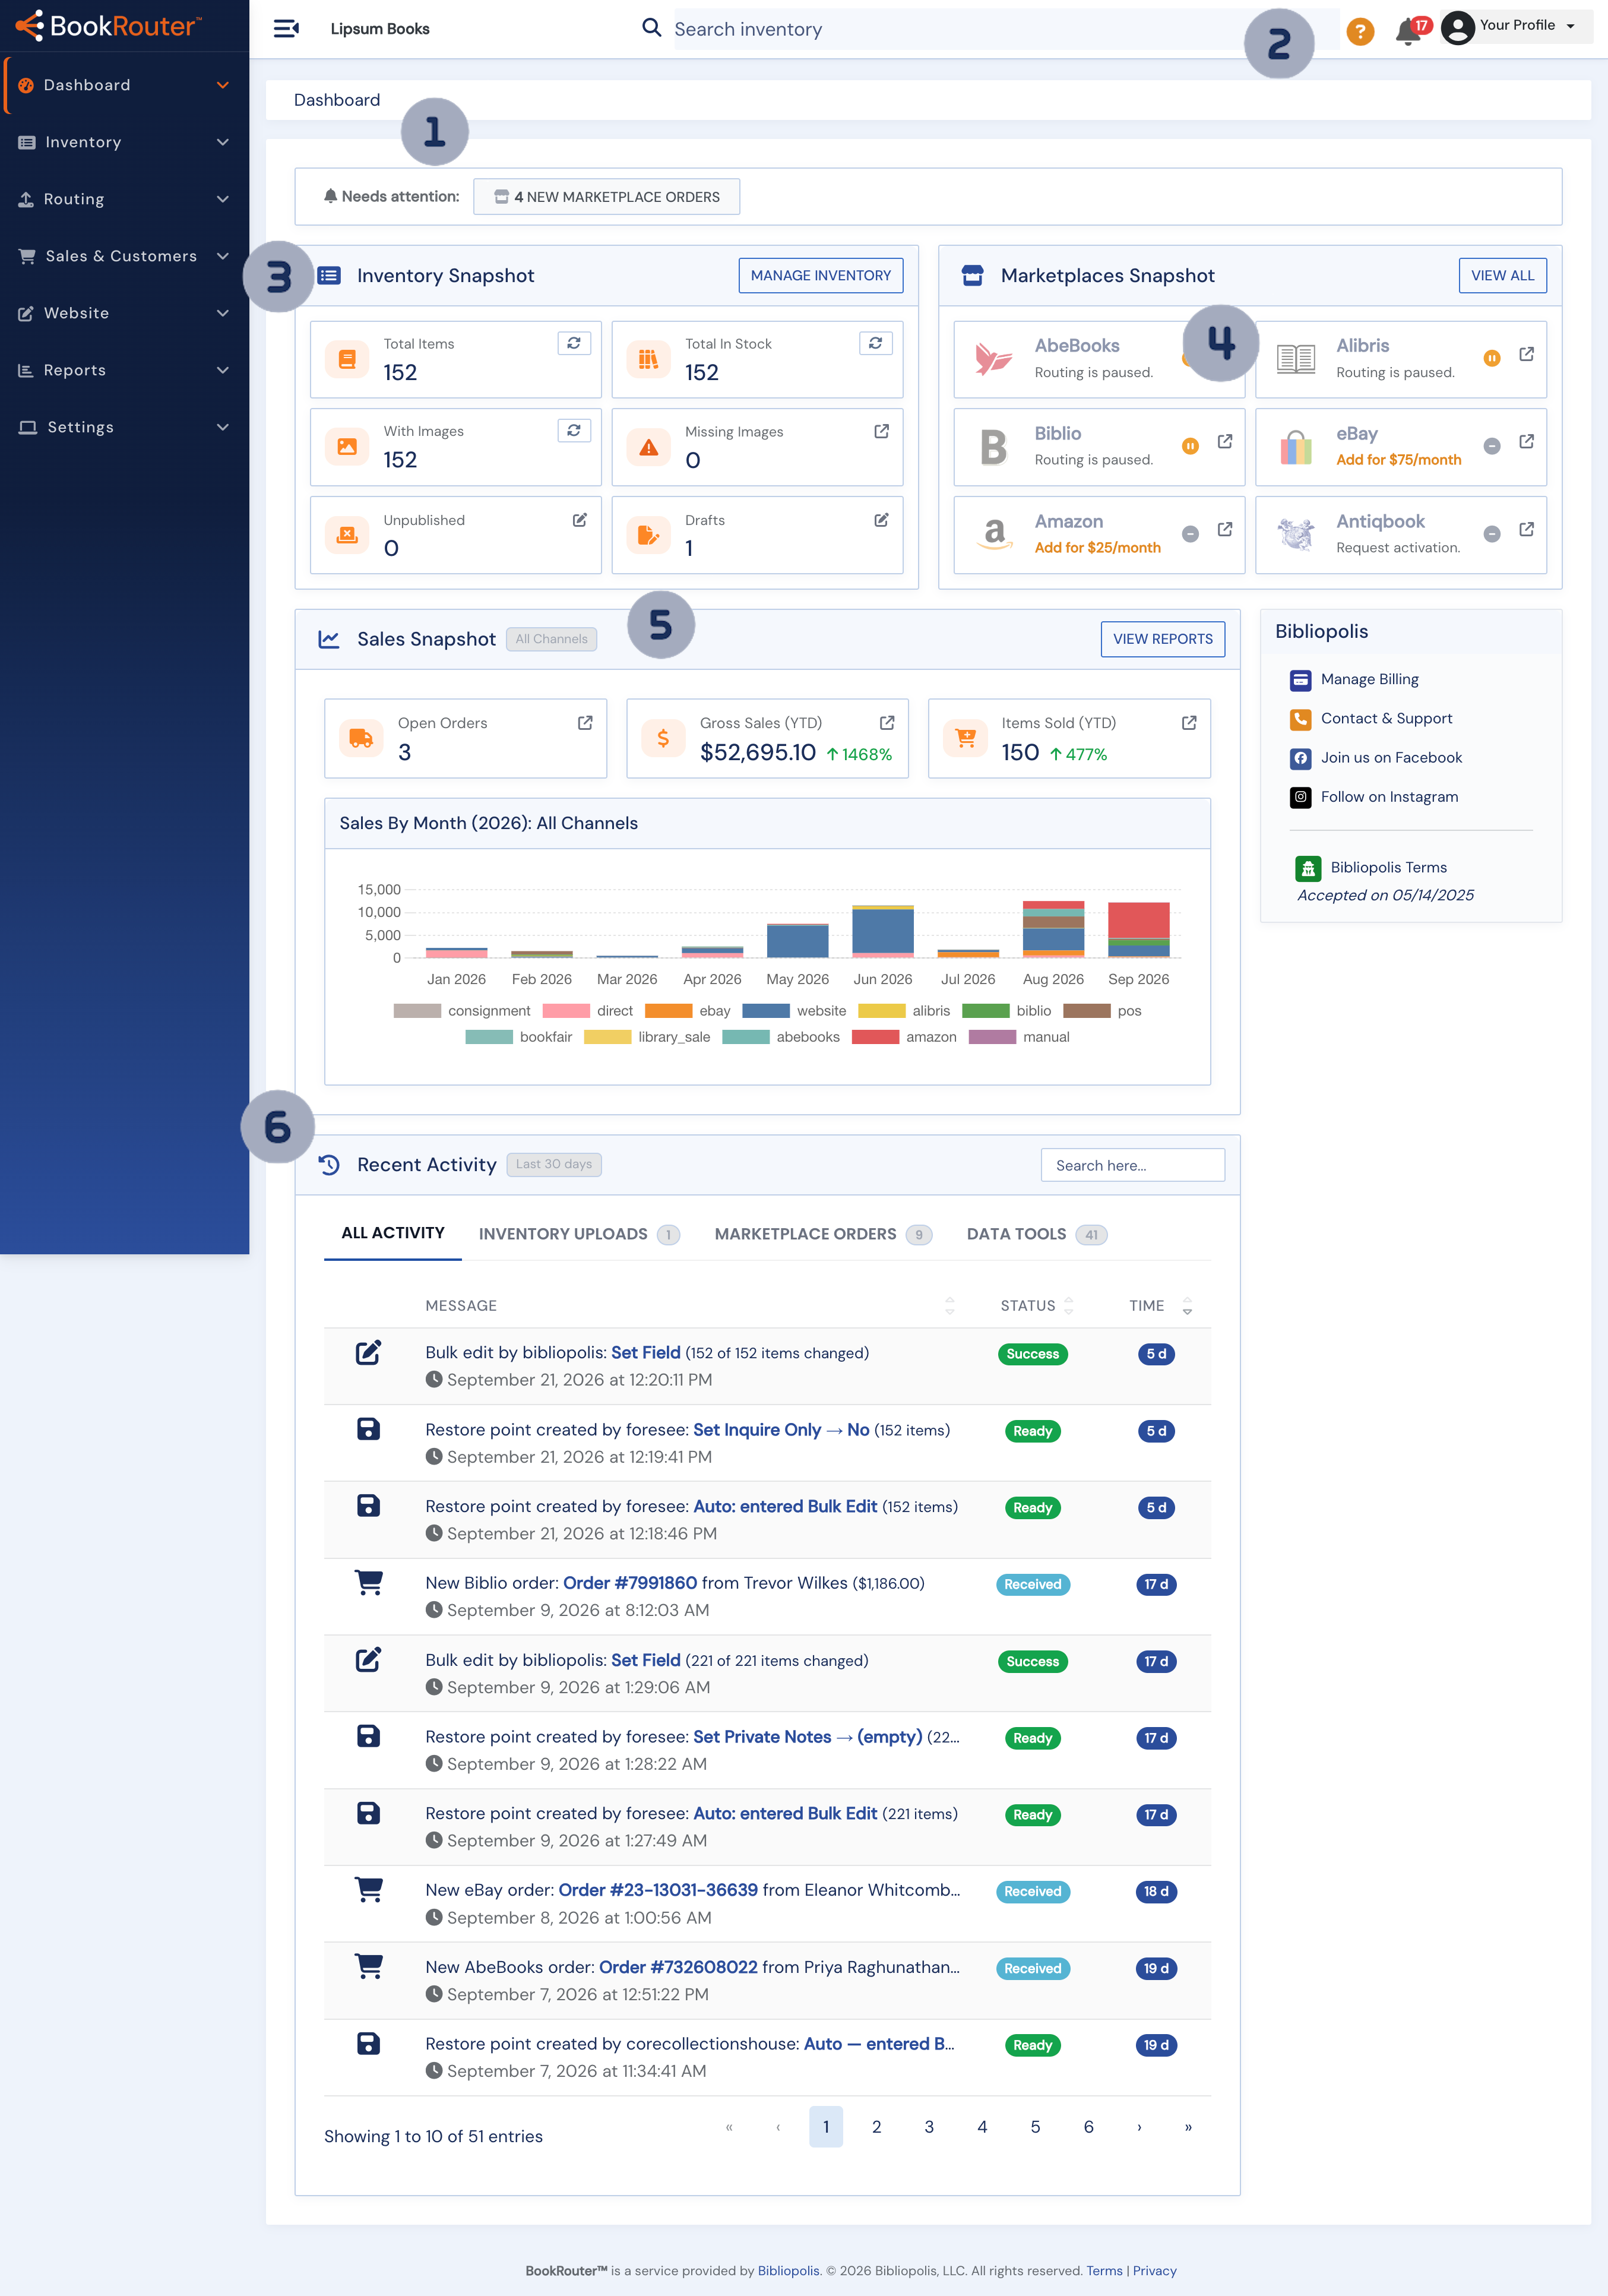
Needs Attention
This rectangular full-width section of the dashboard alerts you to items that need attention. Orders that need to be shipped, abandoned shopping carts, active want-list matches, and new customer inquiries. Each item links straight to the page where you handle it. When there is nothing outstanding, the strip stays hidden.
Notifications
The bell icon turns red and does a little jig when there are announcements or important account notifications. Important, actionable notices (billing, marketplace disconnections) also appear as colored banners at the top of every page until resolved. When you first log in, a drawer with new alerts will open at the bottom of your browser window.
Inventory Snapshot
At-a-glance counts for your stock: total items, in stock, with and without images, unpublished, and drafts. Each tile links to the matching filtered view of Manage Inventory.
Marketplaces
Each marketplace you route to gets a tile showing its connection status and recent activity. If a connection needs attention — an expired eBay token, for example — you'll also see a notification banner at the top of the page until it's fixed.
Sales Snapshot
Revenue and items sold for the year (with comparison to the prior period), open orders, and a monthly sales chart. If multi-channel sales display is enabled for your account, the chart is stacked by channel so you can see website, marketplace, in-store, and invoice sales together. Clicking a month drills into the Sales report for that period.
Recent Activity
A running log shows you what is going on under the hood. See when items are added or removed from marketplaces, when orders arrive and, crucially, when there are errors so you can make sure everything is running smoothly.
When in doubt, return to the Dashboard: Should you get lost, the dashboard is the quickest jumping-off point. The tiles and chart segments are clickable and take you to the matching report or management page with the right filters already applied.